GROUP RESULTS AT A GLANCE
for the year ended 30 June 2016
| Audited year ended 30 June | % change | |||||||||||
| Key features | 2016 | 2015 | 2014 | 2013 | 2016/15 | 2015/14 | 2014/13 | |||||
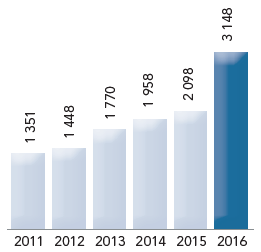
| Healthcare service revenue | (R’000) | 2 399 669 | 2 098 312 | 1 958 260 | 1 770 330 | 14.3 | 7.2 | 10.6 | ||||
|---|---|---|---|---|---|---|---|---|---|---|---|---|
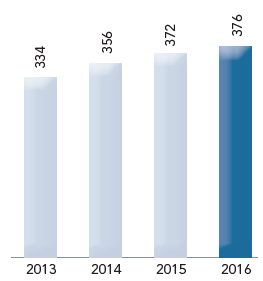
| Healthcare service operating profit | (R’000) | 344 155 | 372 072 | 356 357 | 333 657 | (4.6) | 4.4 | 6.8 | ||||
| Healthcare retail revenue | (R’000) | 748 477 | ||||||||||
| Healthcare retail gross profit | (R’000) | 160 273 | ||||||||||
| Headline earnings | (R’000) | 182 156 | 179 527 | 183 945 | 129 637 | 1.4 | (2.3) | 41.9 | ||||
| Cash generated from operations | (R’000) | 393 851 | 396 996 | 321 044 | 340 413 | (0.8) | (5.7) | |||||
| Statutory earnings per share | ||||||||||||
| – Basic | (cents) | 30.79 | 33.08 | 40.00 | 60.75 | (6.9) | (17.3) | (34.2) | ||||
| – Diluted | (cents) | 29.40 | 33.08 | 40.00 | 36.11 | (11.1) | (17.3) | 10.8 | ||||
| Statutory headline earnings per share | ||||||||||||
| – Basic | (cents) | 32.94 | 38.43 | 47.83 | 48.15 | (14.2) | (19.7) | (0.7) | ||||
| – Diluted | (cents) | 31.45 | 38.43 | 47.83 | 28.62 | (18.2) | (19.7) | 67.1 | ||||
| Dividends paid per ordinary share | (cents) | 24.00 | 20.00 | 18.00 | 15.00 | |||||||
| Share price as at 30 June | (Rand) | 5.25 | 5.15 | 4.45 | 3.90 | |||||||
| Group membership | (R’000) | 1 625 196 | 1 396 329 | 1 417 970 | 1 405 233 | |||||||
| Open schemes | (R’000) | 365 606 | 366 998 | 368 411 | 368 832 | |||||||
| Closed and Corporate schemes | (R’000) | 287 156 | 111 328 | 112 990 | 119 854 | |||||||
| GEMS | (R’000) | 682 225 | 665 303 | 683 712 | 673 966 | |||||||
| SADEC and other | (R’000) | 290 209 | 252 700 | 252 857 | 242 581 | |||||||
|
|

CONSOLIDATED PROFIT STATEMENT
| Audited year ended 30 June | % change | |||||||||
| 2016 R'000 |
2015 R'000 |
2014 R'000 |
2013 R'000 |
2016/15 | 2015/14 | 2014/13 | ||||
| Healthcare service revenue | 2 399 669 | 2 098 312 | 1 958 260 | 1 770 330 | 14.3 | 7.2 | 10.6 | |||
|---|---|---|---|---|---|---|---|---|---|---|
| Healthcare service operating costs | (2 055 514) | (1 726 240) | (1 601 903) | (1 436 673) | ||||||
| Healthcare service operating profit | 344 155 | 372 072 | 356 357 | 333 657 | (7.5) | 4.4 | 6.8 | |||
| Healthcare retail revenue | 748 477 | |||||||||
| Healthcare retail cost of sales | (588 204) | |||||||||
| Healthcare retail gross profit | 160 273 | |||||||||
| Healthcare retail operating costs | (128 067) | |||||||||
| Total healthcare operating profit | 376 361 | 372 072 | 356 357 | 333 657 | 1.2 | 4.4 | 6.8 | |||
| Other income | – | – | – | 2 307 | ||||||
| Net finance and investment income | 54 924 | 18 802 | 17 699 | 13 420 | ||||||
| Impairment of assets | (21 469) | (36 697) | (36 900) | 7 253 | ||||||
| Profit on sale of investment | – | – | – | 51 014 | ||||||
| Share of associate (losses)/profits | 10 118 | 19 037 | 4 343 | (21 477) | ||||||
| Share-based payment expense | (6 444) | (9 395) | (10 765) | (39 868) | ||||||
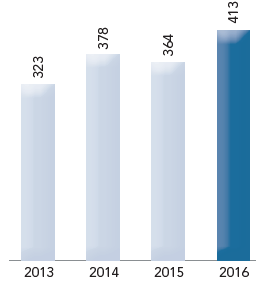
| Profit before impairment and amortisation | 413 490 | 363 819 | 330 735 | 346 306 | 13.6 | 10.0 | (4.4) | |||
| Depreciation | (38 011) | (35 727) | (40 475) | (37 251) | ||||||
| Amortisation of intangible assets | (79 332) | (48 734) | (43 907) | (40 098) | ||||||
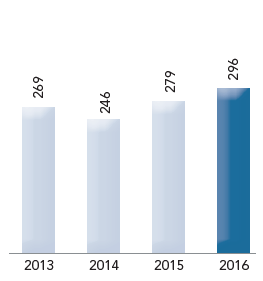
| Profit before income taxation | 296 147 | 279 358 | 246 353 | 268 957 | 6.0 | 13.4 | (8.4) | |||
|
|
|
SUMMARISED CONSOLIDATED STATEMENT OF FINANCIAL POSITION
| Audited year ended 30 June 2016 R'000 |
Audited year ended 30 June 2015 R'000 |
Audited year ended 30 June 2014 R'000 |
|||
| ASSETS | |||||
| Non-current assets | 2 190 076 | 991 080 | 881 257 | ||
| Property and equipment | 189 362 | 102 639 | 100 143 | ||
| Investment property | 15 000 | 15 000 | 15 000 | ||
| Goodwill | 872 078 | 398 123 | 398 123 | ||
| Intangible assets (Note 1) | 516 737 | 346 364 | 205 029 | ||
| Available for sale investment | 18 444 | 18 444 | – | ||
| Financial asset at fair value through profit and loss | 37 182 | – | – | ||
| Managed funds and deposits | 411 934 | – | – | ||
| Investment in associates | 24 477 | 14 873 | 77 183 | ||
| Deferred income tax assets | 104 862 | 95 637 | 85 779 | ||
| Current assets | 850 640 | 569 738 | 679 450 | ||
| Trade and other receivables | 365 004 | 228 884 | 190 828 | ||
| Investment in preference share | – | – | 90 000 | ||
| Inventory | 72 310 | 6 803 | 4 610 | ||
| Current tax asset | 19 821 | – | 4 563 | ||
| Receivables from associates and joint venture | 20 437 | – | – | ||
| Cash and cash equivalents | 373 068 | 334 051 | 389 449 | ||
| Non-current asset held for sale | – | 24 788 | – | ||
| Total assets | 3 040 716 | 1 585 606 | 1 560 707 | ||
| EQUITY AND LIABILITIES | |||||
| Capital and reserves | 1 047 979 | 1 104 149 | 1 070 968 | ||
| Issued ordinary share capital | 18 686 | 17 821 | 17 821 | ||
| Issued ordinary share premium | 970 358 | 525 633 | 525 633 | ||
| Conditional put option reserve | (727 960) | – | – | ||
| Share-based payment reserve | 26 604 | 20 160 | 10 765 | ||
| Treasury shares | (2 324) | (2 324) | (2 324) | ||
| Foreign currency translation reserve | 7 027 | 2 204 | 1 337 | ||
| Distributable reserve | 755 588 | 540 655 | 517 736 | ||
| Non-controlling interest | 515 603 | 62 930 | 52 634 | ||
| Total equity | 1 563 582 | 1 167 079 | 1 123 602 | ||
| Non-current liabilities | 977 573 | 86 252 | 171 117 | ||
| Deferred income tax liabilities | 82 390 | 54 822 | 43 188 | ||
| Non-current borrowings | – | – | 112 946 | ||
| Non-current provisions | 8 350 | 8 350 | 8 350 | ||
| Post-employment medical obligations | 2 691 | 3 134 | 3 202 | ||
| Second tranche payment | 134 893 | – | – | ||
| Conditional Financial Obligation | 727 960 | – | – | ||
| Accrual for straight lining of leases | 21 289 | 19 946 | 3 431 | ||
| Current liabilities | 499 561 | 332 275 | 265 988 | ||
| Borrowings | – | 61 224 | 44 877 | ||
| Provisions | 9 755 | 9 211 | 9 105 | ||
| Trade and other payables | 383 029 | 146 317 | 121 887 | ||
| Taxation | – | 4 418 | – | ||
| Employment benefit provisions | 106 777 | 111 105 | 90 119 | ||
| Total liabilities | 1 477 134 | 418 527 | 437 105 | ||
| Total equity and liabilities | 3 040 716 | 1 585 606 | 1 560 707 |