


 58 / 136

AfroCentric INTEGRATED ANNUAL REPORT 2016
56
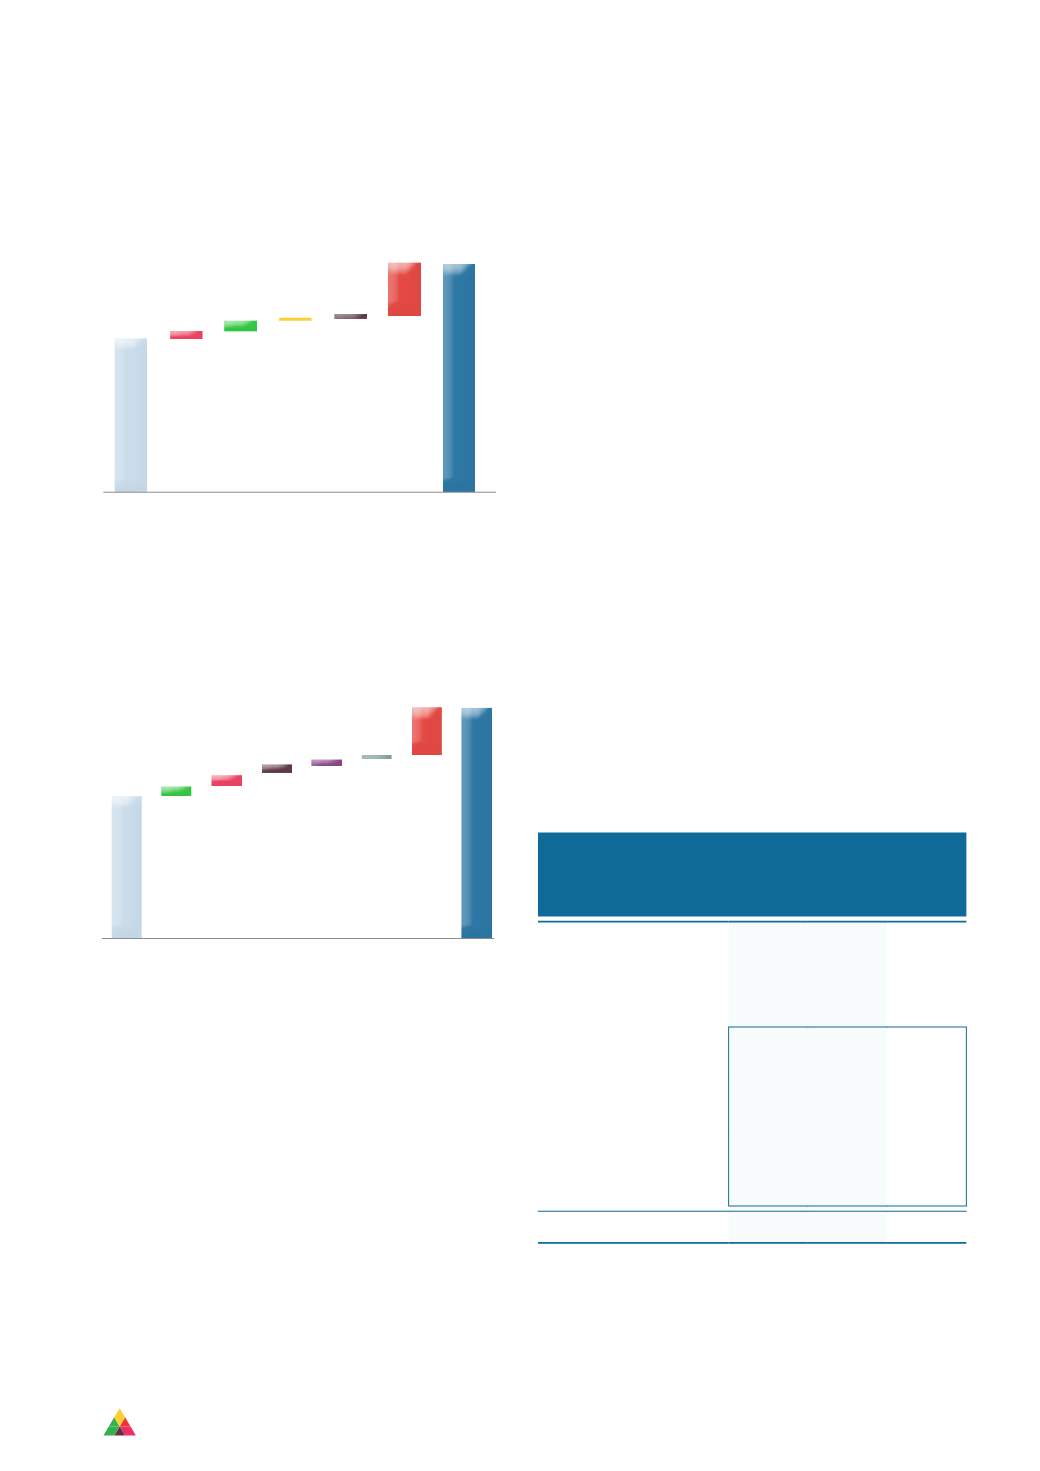
2016 Revenue growth
2 098
R’million
3 148
94
748
148
17
FY 2015
FY 2016
Fee increase on
2015 client base
Health retail
Polmed &
Samwumed
Africa
IT and other
start-ups
43
COST OF SALES AND OPERATING COSTS
R’million
2 772
28
15
41
135
702
125
1 726
FY 2016
Head office restructuring
Sanlam/WAD
consulting/advisory
IT
Polmed & Samwumed
including set-up
Health retail COS
2015 Base increase
FY 2015
The take-on costs of the Polmed scheme prior to
implementation on 1 January 2016 is expensed in the first
year, and entails items such as early uptake of employees
to be trained, early office space activation to accommodate
employees and IT resources for data uploading and benefit
design. As a result of these once-off costs that are not
capitalised to the three-year contract period tendered upon,
the net profit of the scheme is not yet visible at a Group level
and is at a breakeven for the 2016 financial year.
We continue to increase our spend on clinical research
and analysis as well as improving our systems to manage
the demands of the future. This is due to the continuous
demands from clients and our vision of decreasing the
healthcare spend of our schemes administered.
To effect the changes in the top executive structures of
AfroCentric, the Group incurred R21 million incremental
costs, most of which will not be recurring in 2017.
CAPITAL EXPENDITURE, DEPRECIATION
AND AMORTISATION OF INTANGIBLE
ASSETS
As a result of the acquisition of the Pharmacy Direct and
Curasana businesses, the intangible assets recognised at
acquisition created a significant increase in amortisation of
these assets.
The IFM system has been implemented for the Bonitas
Medical Fund and various other smaller schemes in the
Group. However, the success of combatting fraud and
reducing medical scheme healthcare cost abuse will only be
seen in the 2017 financial year, as schemes start adopting
various strategies to address fraud. The revenue for this
product has exceeded expectations for the first year,
however, there is still significant growth expected as we
commence rolling this product out to many of our South
African and SADEC schemes.
The table below sets out the variance in intangible asset
amortisation and recognition compared to 2015.
Carrying
value
Amortisation
Other intangible assets
2016
R’000
2016
R’000
2015
R’000
Customer relationships –
WAD Acquisition
81 282
(8 203)
–
AfroCentric Health
intangible assets
435 455 (71 129)
(48 734)
AfroCentric Health
intangible PPA
68 436 (13 811)
(15 951)
AfroCentric Health
intangible Software
278 399 (39 062)
(28 589)
Insurance Fraud Manager
(Fraud Management
Software)
88 620 (18 256)
(4 194)
516 737 (79 332)
(48 734)
CHIEF FINANCIAL OFFICER’S REPORT (continued)
Cost of sales and operating costs