


 101 / 136

AfroCentric INTEGRATED ANNUAL REPORT 2016
99
Governance and sustainability
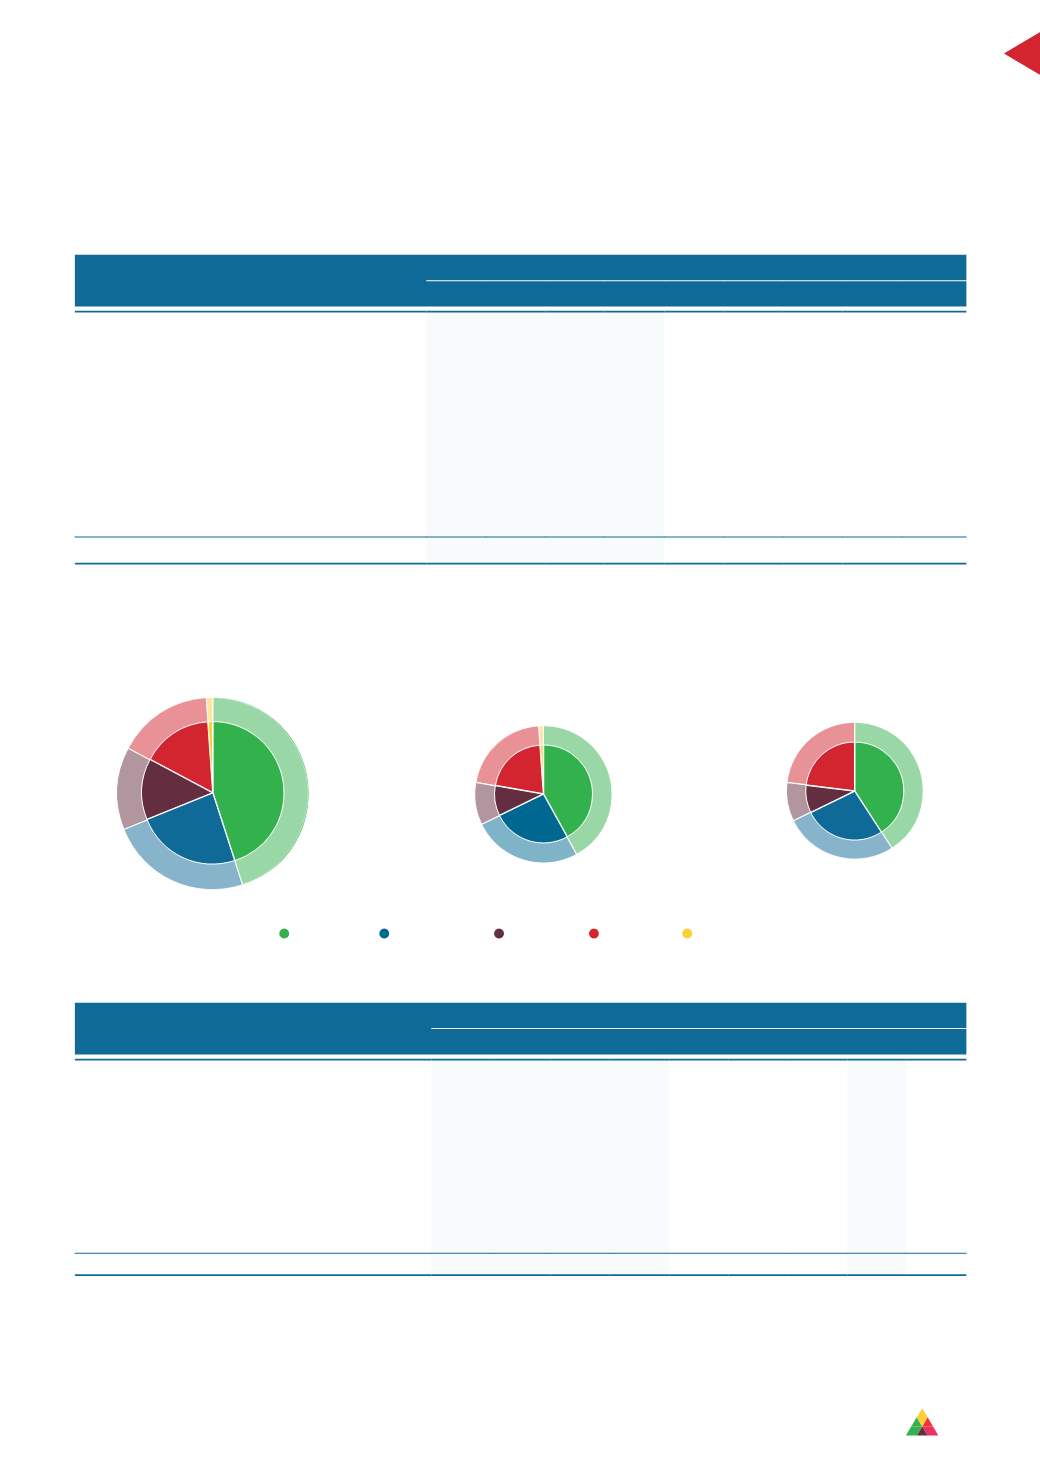
AFROCENTRIC HEALTH (PTY) LIMITED
Total workforce profile (including employees with disabilities) as at 30 June 2016
Male
Female
Total
Occupational Levels
A C
I
W A C
I
W
Top management
1
1
2
5
2
–
–
–
11
Senior management
8
1
5 16
3
2
3 11
49
Professionally qualified and experienced
specialists and mid-management
40 17 32 55 47
37 44 131 403
Skilled technical and academically qualified
workers, junior management, supervisors,
foremen, and superintendents
357 214 95 78 961 649 179 431 2 964
Semi-skilled and discretionary decision making 31
2
6
3 61
13
3 21 140
Unskilled and defined decision making
5
2
–
1
5
1
1
–
15
GRAND TOTAL
442 237 140 158 1 079 702 230 594 3 582
Total workforce (including employees with disabilities)
African Coloured Indian White Foreign nationals
Total – 3 582
Male – 977
Female – 2 605
42%
26%
10%
21%
1%
41%
27%
9%
23%
24%
45%
14%
16%
1%
Profile of employees for people with disabilities as at 30 June 2016
Male
Female
Total
Occupational Levels
A C
I
W A C
I
W
Top management
–
–
–
–
–
–
–
–
–
Senior management
–
–
–
–
–
–
–
–
–
Professionally qualified and experienced
specialists and mid-management
–
1
–
1
–
–
1
4
7
Skilled technical and academically qualified
workers, junior management, supervisors,
foremen, and superintendents
7
6
1
1
8 11
3 13 50
Semi-skilled and discretionary decision making
3
–
1
–
3
–
1
1
9
Unskilled and defined decision making
–
–
–
–
–
–
–
–
–
GRAND TOTAL
10
7
2
2 11 11
5 18 66