



 115 / 146

111
INTEGRATED REPORT 2017
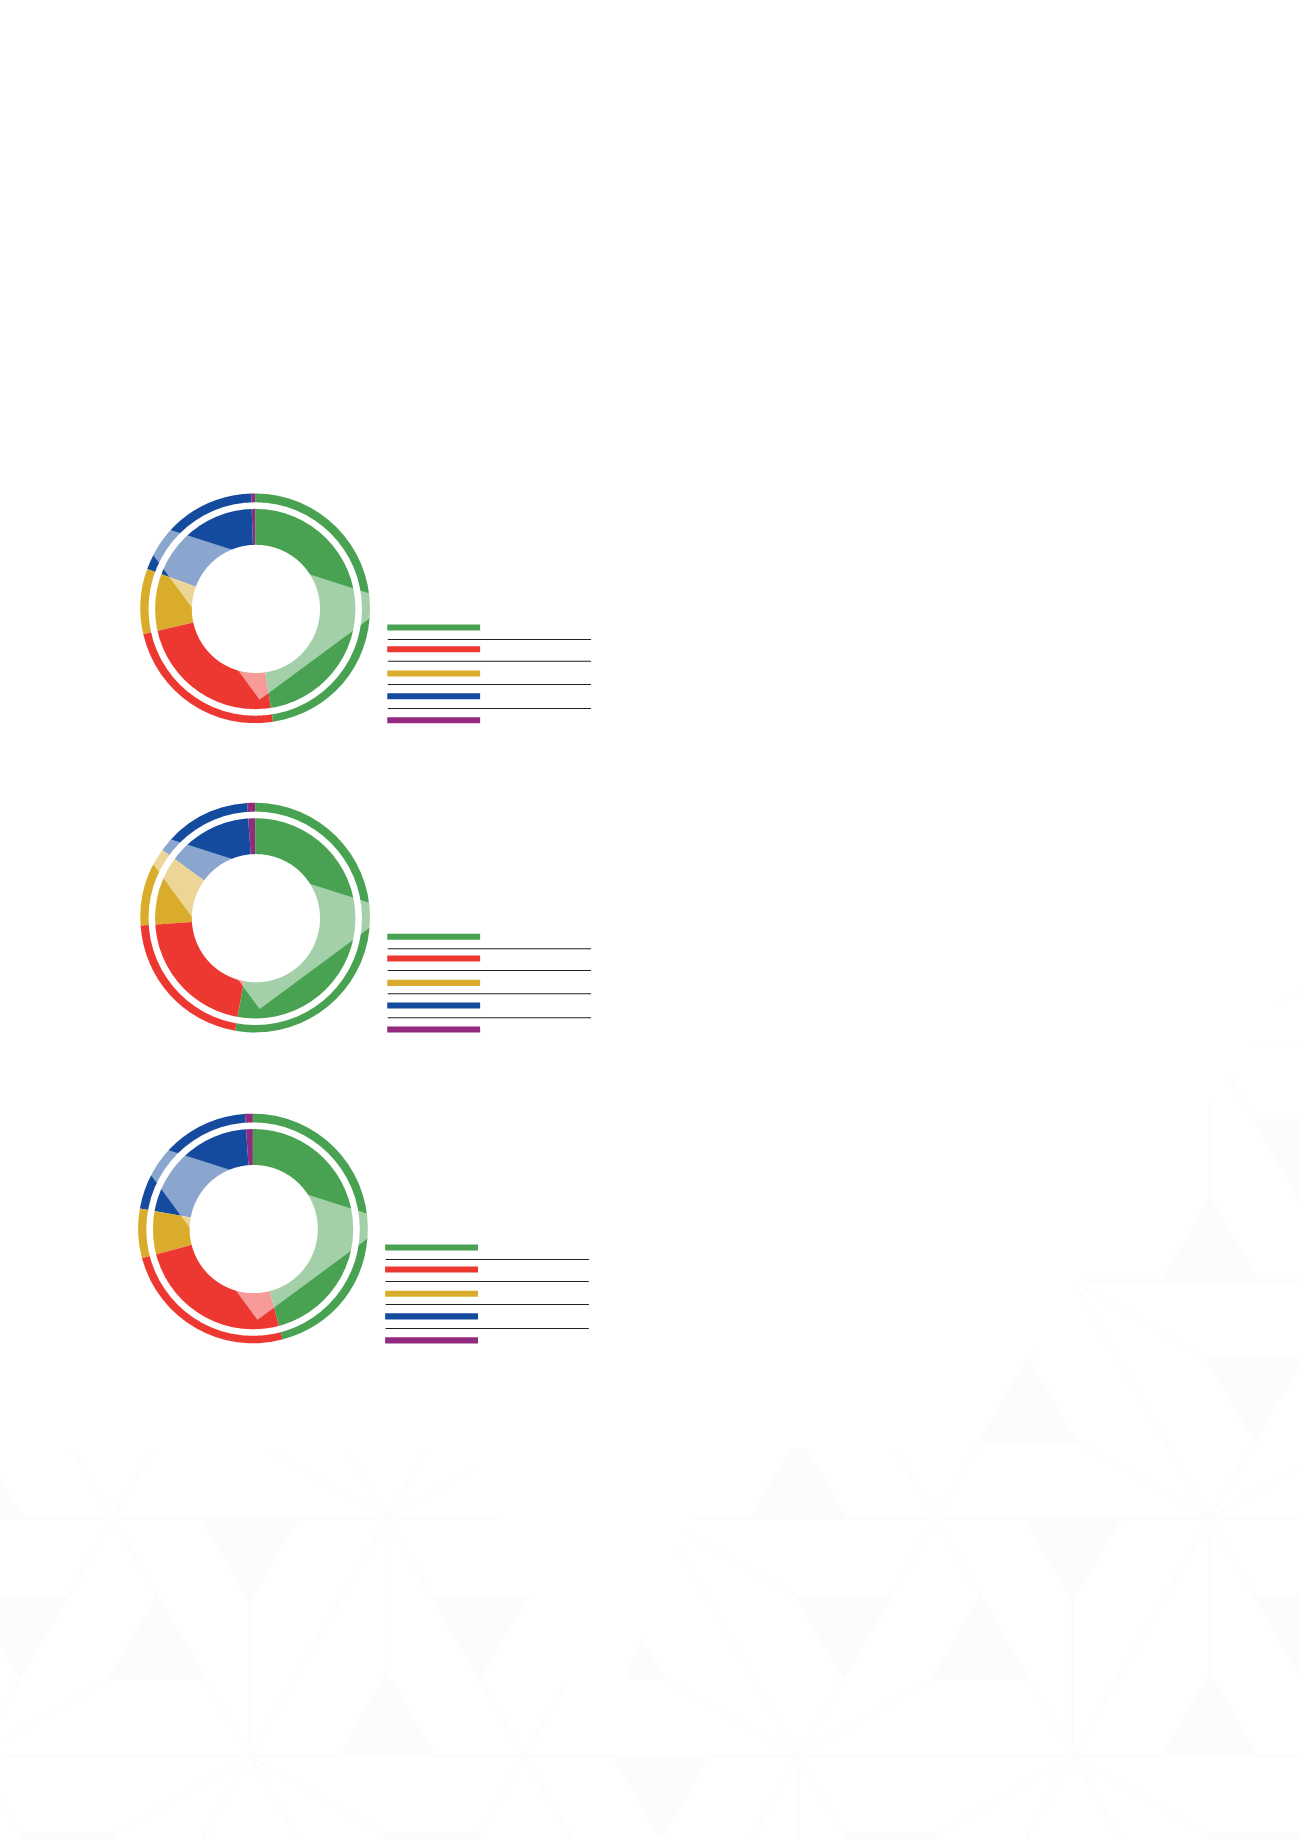
Total workforce (including employees
with disabilities)
48
24
8.5
19
% OF TOTAL EMPLOYEES – 4 479
Coloured
Indian
White
African
Foreign nationals
0.5
53
21
11
14
% OF MALE EMPLOYEES – 1 299
Coloured
Indian
White
African
Foreign nationals
1
46
1
25
7
21
% OF FEMALE EMPLOYEES – 3 180
Coloured
Indian
White
African
Foreign nationals
Employees with disabilities
One of our main focus areas in creating a diverse workforce
is employees with disabilities. Several interventions over
the financial year encouraged managers to employ people
with disabilities, as well as to better support employees with
disabilities already in the business.
Some of these interventions included manager sensitisation
sessions which were run across the business for all managers,
to better understand disability and its importance in the
workplace, and to better support disabled employees.
Employee sessions were run to create a better understanding
of what a disability is, how to interact with the disabled as
well as how to disclose a disability. It is our intention to run
frequent manager and employee sessions to build a culture
of openness and trust.
The business further made a commitment to develop people
with disabilities by employing four people on a contract to
be trained and potentially employed in the future. These
employees are being up-skilled in various learning paths,
creating a skilled recruitment pool to draw from for potential
future vacancies.
This focus has made great strides, and has increased our
headcount of employees with disabilities by 28 from the
previous financial year. The headcount of our employees with
disabilities, as at the end of our financial year, is depicted in the
table below.